►Load a data file in csv or txt fomat (tab separator)
►If the columns have headers, check the box
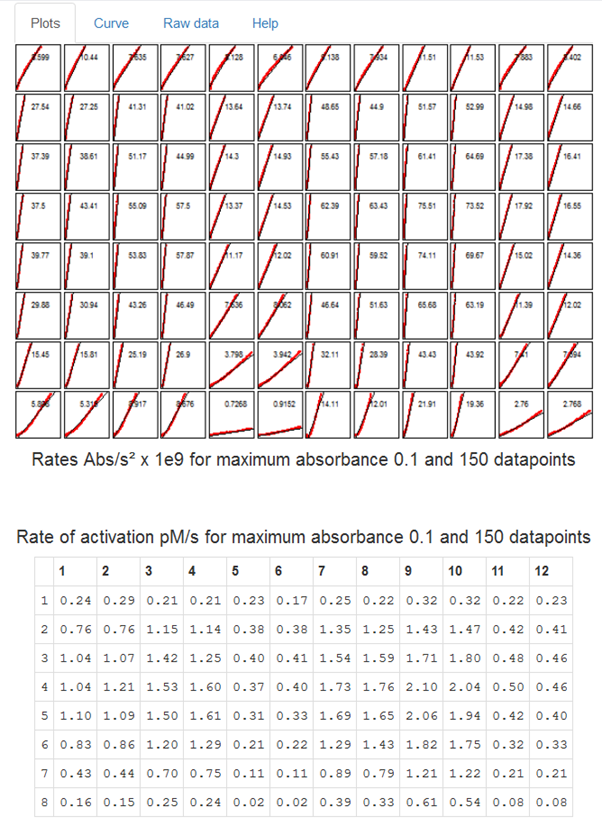
►Select the number of rows to organise the graphs and table
►All the plots are shown or individual curves can be analysed on the next tab
►Select the cut off for maximum absorbance
►Choose how many data points you want to include
►Tick the box if you want to zero each curve at the first absorbance reading
►Select time squared to calculate the rate of zymogen activation in ⌂abs/sec²
►If time squared is not selected you can calculate simple rates of substrate hydrolysis over time
►With time squared selected, you can also calculate zymogen activation rates in pM/s if you know the constants for the enzyme on the chromogenic substrate in the boxes shown
►For more details on this calculation, see for e.g. Sinnger, V. et al (1999), J Biol Chem, 274, 12414-22
►Note: Data files should not contain any gaps or spaces between characters
►Avoid unusual characters such as % and ' in names
►Code files and detailed help notes are available in a github repository Here
►Other apps and links for reproducible analysis in haemostasis assays are available here
►Please contact me with problems or suggestions relating to: Zymogen activation app version version 0.81a last accessed 2026-03-13 at drclongstaff@gmail.com